Designing Data-Intensive Applications [Book Highlights]
[Part I : Chapter III] Storage and Retrieval
Transaction Processing or Analytics?
As databases expanded into areas that didn’t involve money changing hands, the term transaction nevertheless stuck.
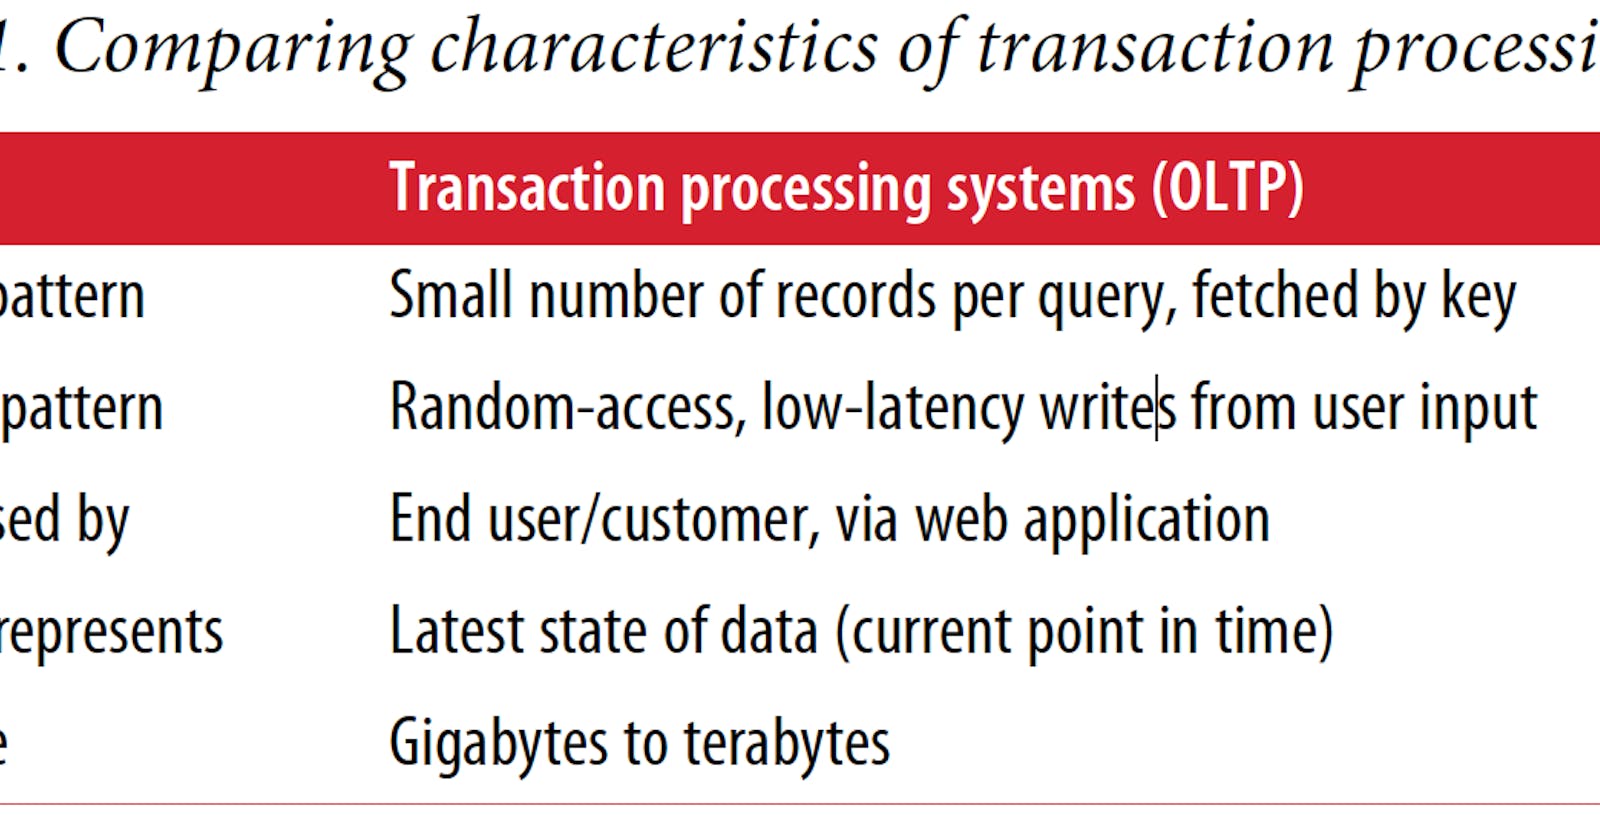
OLTP - Even though databases are used for many different kinds of data, the access pattern remained similar to processing business transactions. allowing clients to make low-latency reads and writes. Because these applications are interactive, the access pattern became known as online transaction processing (OLTP).
OLAP - Databases also started being increasingly used for data analytics, Usually an analytic query needs to scan over a huge number of records, only reading a few columns per record, and calculates aggregate statistics. These type of business analysis queries, that powers reports that help the management of a company make better decisions are called online analytic processing (OLAP).

Nevertheless, in the late 1980s and early 1990s, there was a trend for companies to stop using their OLTP systems for analytics purposes, and to run the analytics on a separate database instead. This separate database was called a data warehouse.
Data Warehousing
- OLTP systems are highly available and process transactions with low latency
- So business analysis queries are often expensive, scanning large parts of the dataset, which can harm the performance of concurrently executing transactions
- Data is extracted from OLTP databases (periodic dump or a continuous streams), transformed into an analysis-friendly schema, cleaned up, and then loaded into the data warehouse. This process of loading data is known as Extract–Transform–Load (ETL)

- indexing algorithms discussed in the first half of this chapter work well for OLTP, but are not very good at answering analytic queries.
- The data model of a data warehouse is most commonly relational, because SQL is generally a good fit for analytic queries
Stars and Snowflakes: Schemas for Analytics
- So basically, for analytics tables the schema is created such that there is one large table may be called as transactions/events (usually referred as facts table). And that main table then will naturally have references to other smaller tables like, products, users, categories, etc (usually referred as dimensions table). So if we try to draw this schema out we see a star shape pattern with the main table at the centre and other tables as hands of stars with links from main table. This pattern is commonly known as a star schema (also known as dimensional modeling)
 Example of a star schema for use in a data warehouse
- The name “star schema” comes from the fact that when the table relationships are visualized, the fact table is in the middle, surrounded by its dimension tables; the connections to these tables are like the rays of a star.
- A variation of this template is known as the snowflake schema, where dimensions are further broken down into subdimensions.
Column-Oriented Storage
- Dimension tables are usually much smaller (millions of rows), so in this section we will concentrate primarily on storage of facts.
- don’t store all the values from one row together, but store all the values from each column together instead. If each column is stored in a separate file, a query only needs to read and parse those columns that are used in that query.
- The column-oriented storage layout relies on each column file containing the rows in the same order.
Column Compression
- Column-oriented storage often lends itself very well to compression
- One Compression technique that is particularly effective in data warehouses is bitmap encoding
- Often, the number of distinct values in a column is small compared to the number of rows
- Example 1
WHERE product_sk IN (30, 68, 69): Load the three bitmaps for product_sk = 30, product_sk = 68, and product_sk = 69, and calculate the bitwise OR of the three bitmaps, which can be done very efficiently - Example 2
WHERE product_sk = 31 AND store_sk = 3:
   Load the bitmaps for product_sk = 31 and store_sk = 3, and calculate the bitwise
   AND. This works because the columns contain the rows in the same order, so the kth
   bit in one column’s bitmap corresponds to the same row as the kth bit in another
   column’s bitmap.

